


Dogecoin Shows ‘Clean’ Bullish Divergence: Crypto Analyst
Reason to trust
![]()
Strict editorial policy that focuses on accuracy, relevance, and impartiality
Created by industry experts and meticulously reviewed
The highest standards in reporting and publishing
Strict editorial policy that focuses on accuracy, relevance, and impartiality
Morbi pretium leo et nisl aliquam mollis. Quisque arcu lorem, ultricies quis pellentesque nec, ullamcorper eu odio.
Este artículo también está disponible en español.
After Dogecoin temporarily fell by more than 22% yesterday amid rumors of a “Black Friday”, the price has since been able to recover at least some of its losses. Nevertheless, DOGE is still down around 11% since the start of the week. This has put the price of Dogecoin in a tricky situation.
Dogecoin Forms Bull Div
Dogecoin breached a critical ascending support line before quickly recovering, a behavior that crypto analyst Kevin (@Kev_Capital_TA) describes as testing the “lines in the sand” for this ongoing bull market structure.
Related Reading: Dogecoin Crashes 20%, But ‘Bull Line’ Signals Hope For HODLers
Kevin’s shared chart indicates that DOGE temporarily dipped below a rising pink trendline that has been in place since mid-2023, yet managed to close the daily candle back above this historically significant support around the $0.138 region—a level that also coincides with the 38.2% Fibonacci retracement level measured from the $0.049 swing low to the approximately $0.738 peak.
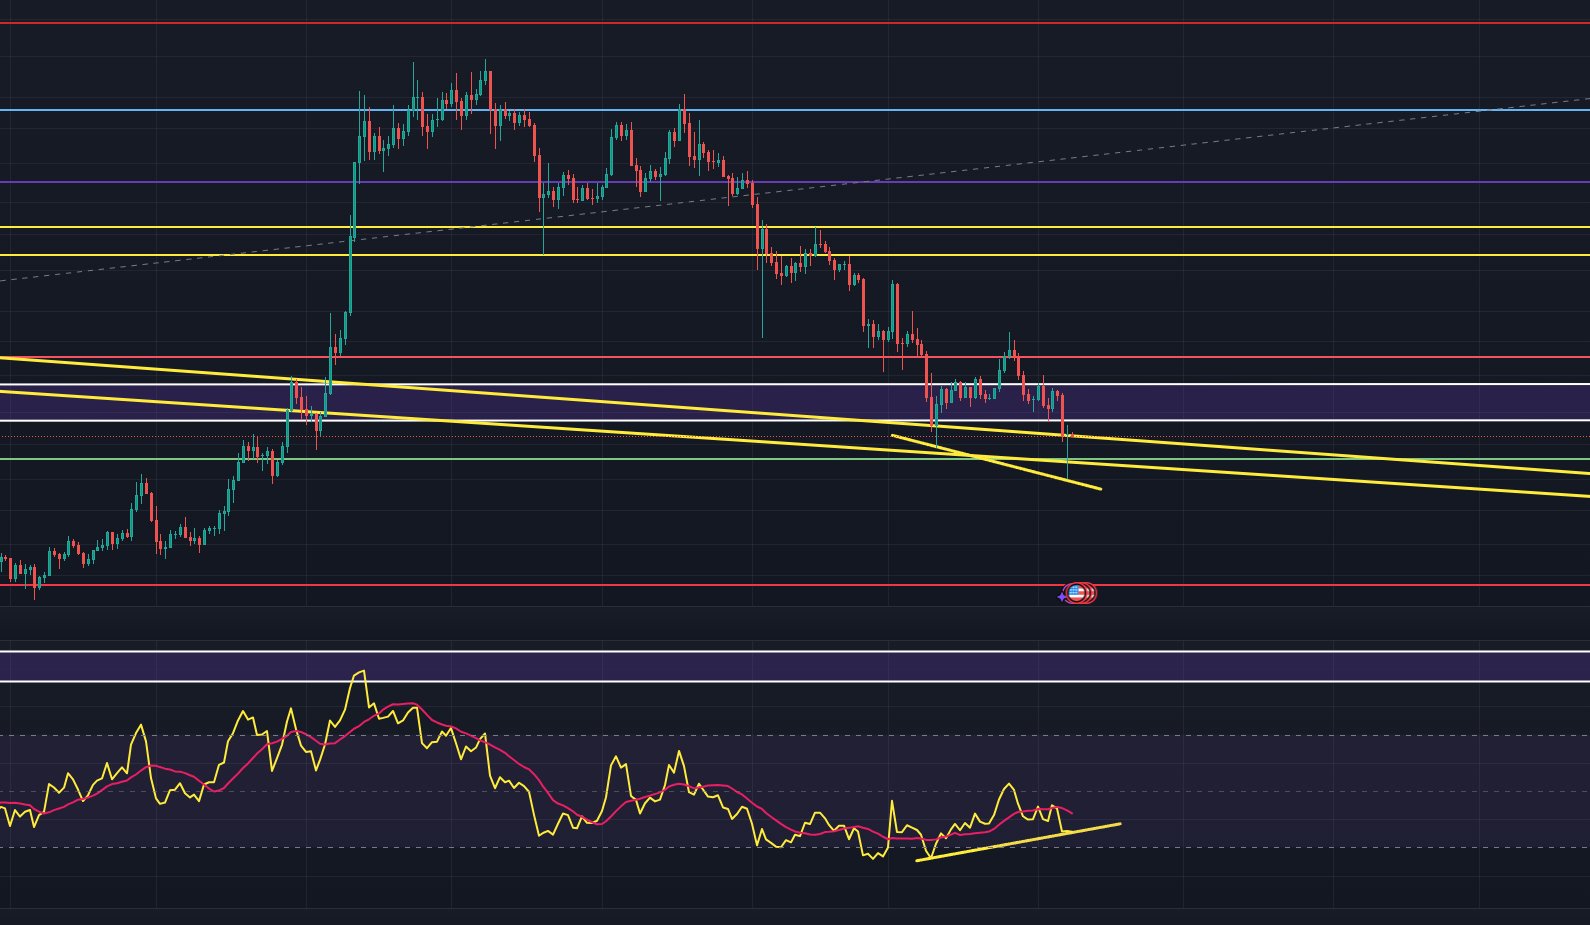
The analyst points out that, despite the intraday break, DOGE’s recovery formed what he calls a “clean bullish divergence” on the daily time frame, referencing the Relative Strength Index which has begun climbing even as price made a slightly lower low. He likened this development to a similar divergence unfolding on Bitcoin’s chart, suggesting that Dogecoin’s momentum may be stabilizing after a series of drawn-out declines from the $0.48 high set early December last year.
DOGE Uptrend Remains Intact
Charting Guy (@ChartingGuy) weighed in separately, highlighting that Dogecoin has arrived once more at its weekly 200 EMA zone—an important trend marker hovering in the mid-$0.13 range—and that its overall structure still shows “higher highs, higher lows” when viewed on a broader timescale.
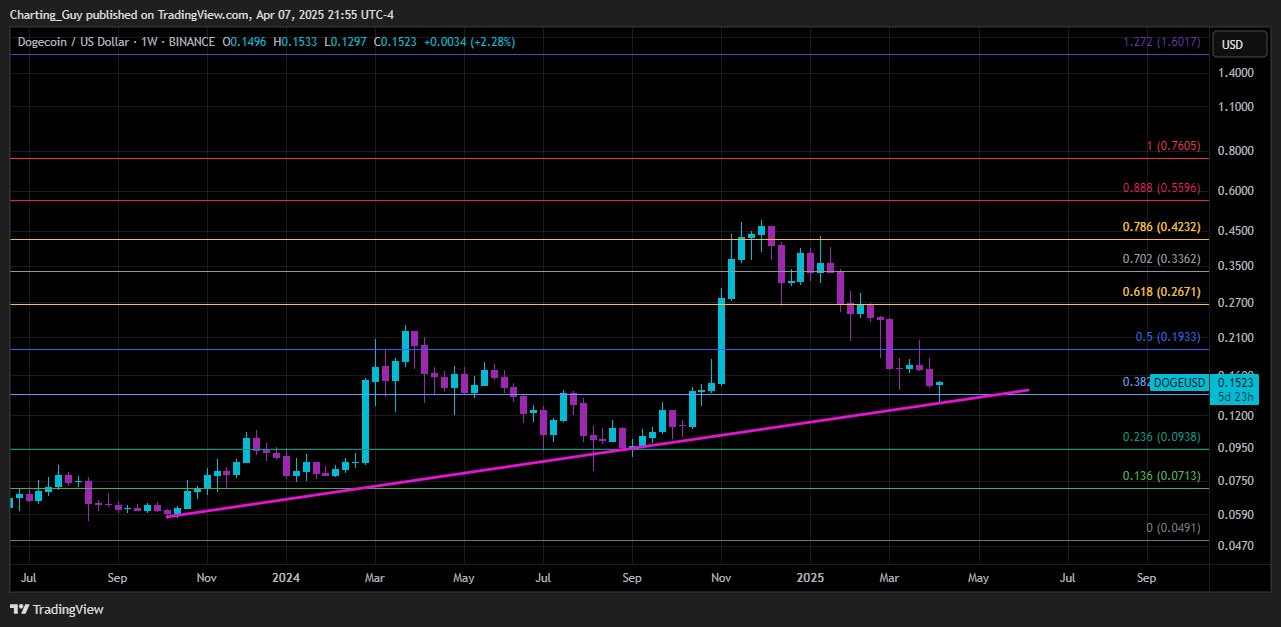
His posted chart also features a Fibonacci analysis which shows that DOGE could manage to close above the 0.382 Fib level, reinforcing the notion that DOGE’s ability to hold above $0.15 could be a crucial gauge of bullish continuation. Failure to sustain this level, however, would risk revisiting deeper Fibonacci support levels, including the 23.6% retracement near $0.09 or even the 13.6% level around $0.07.
Related Reading
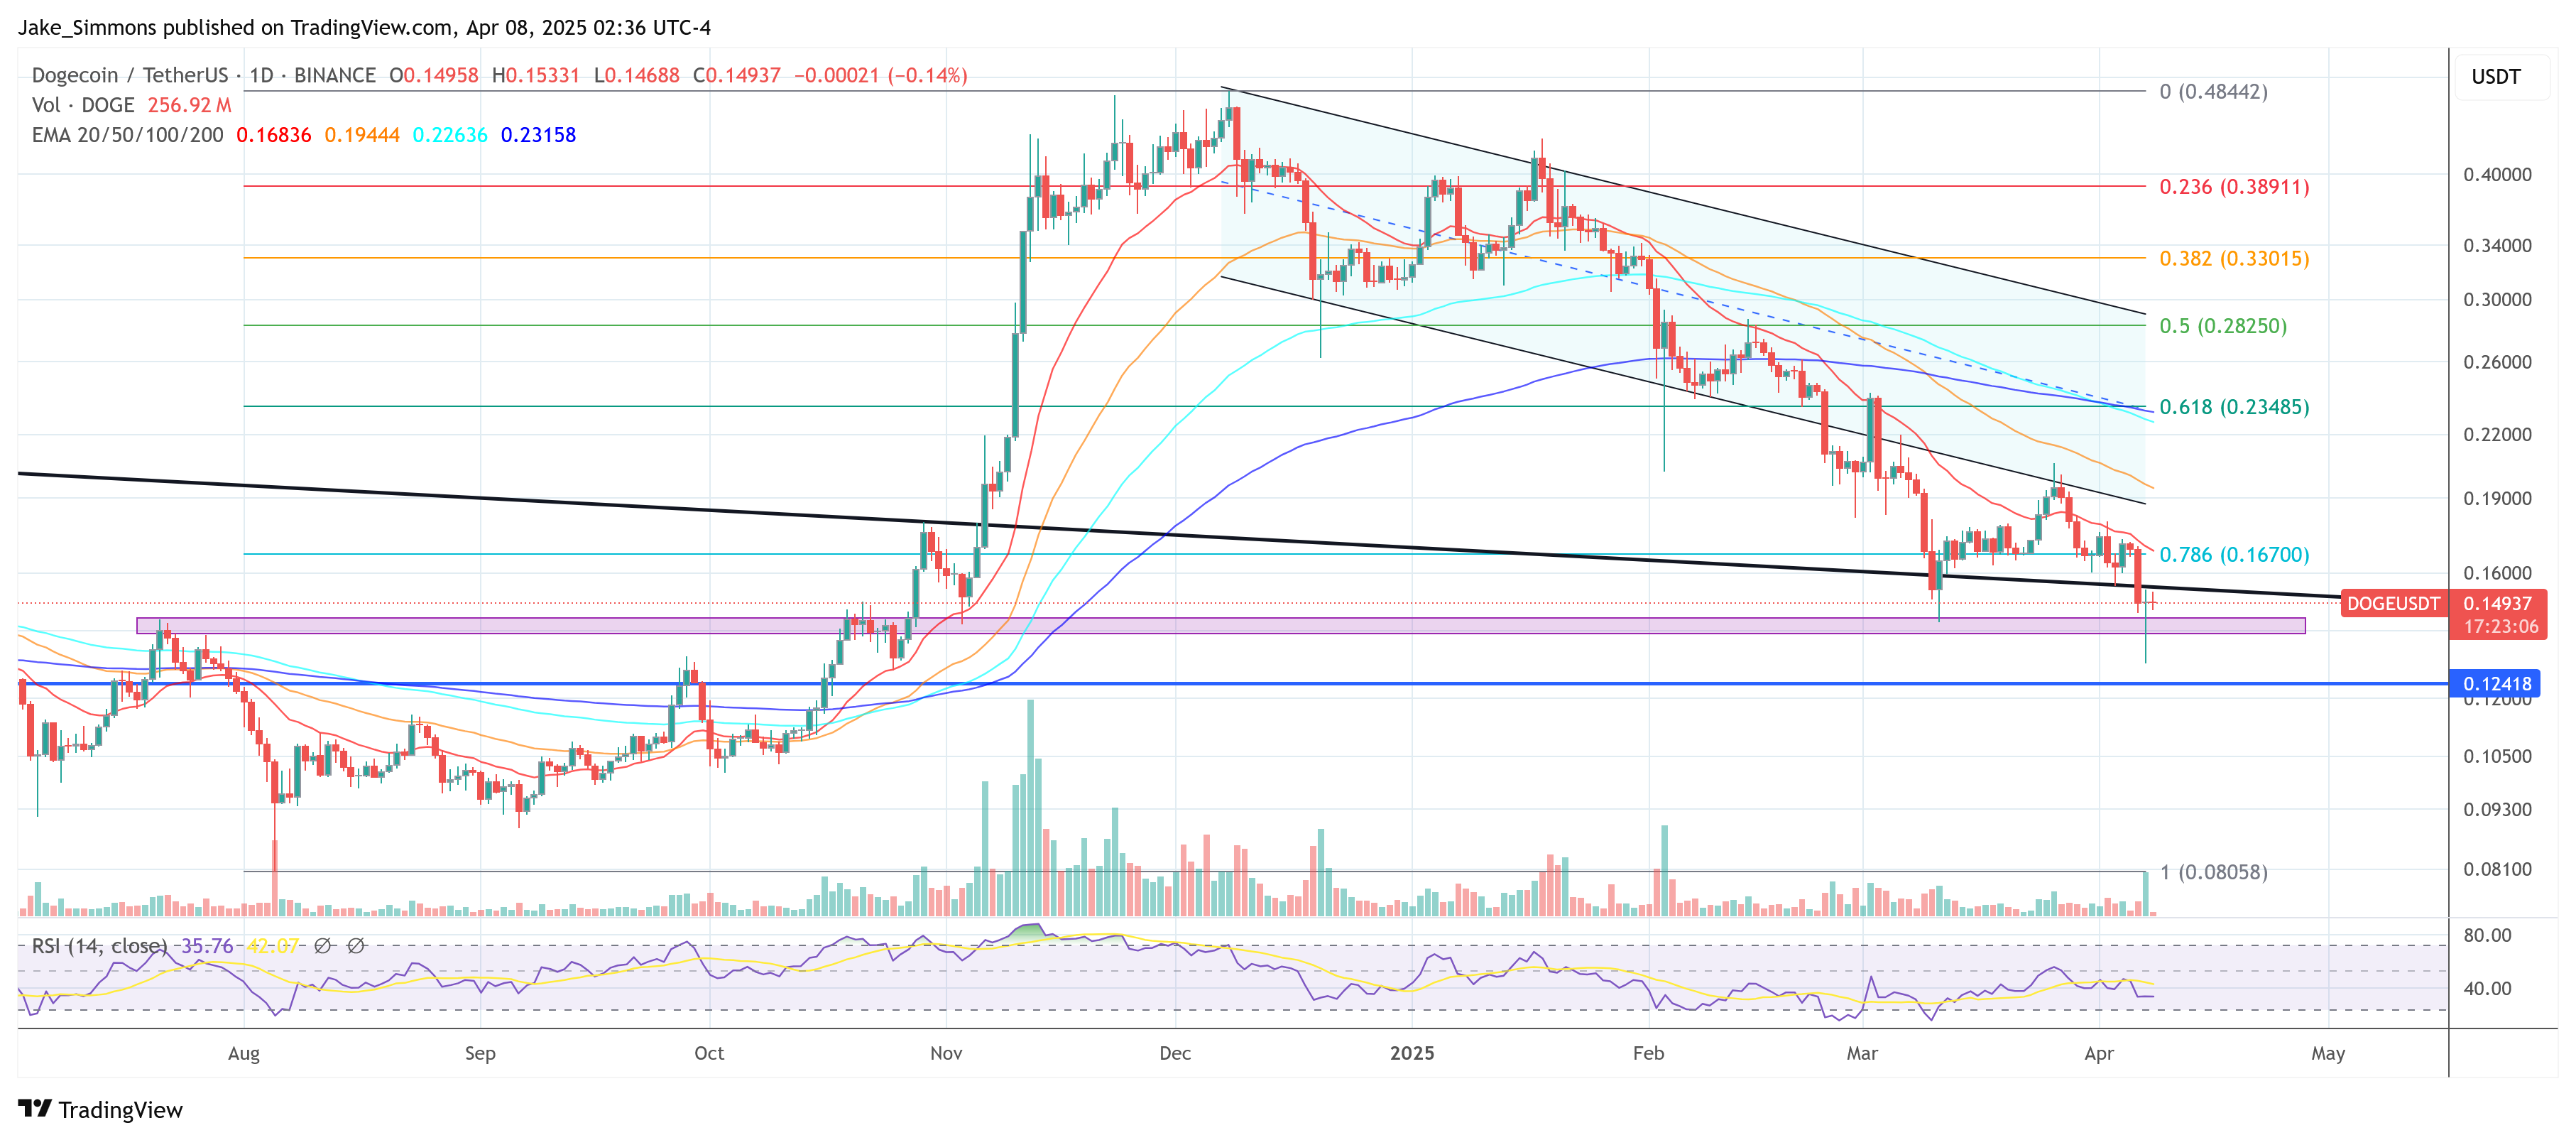
On the upside, traders may look to potential resistance zones in the mid-$0.20s, which line up with the 61.8% Fibonacci retracement at roughly $0.2671, and the high-$0.30s to low-$0.40s range tied to deeper retracement zones up to the 78.6% mark.
The chart watcher also notes that a retest of the prior swing highs above $0.40 would align with an extended push toward the 88.8% Fibonacci near $0.56, although market participants remain cautious amid the broader volatility that is brought to the market by US President Donald Trump’s tariff policies.
At press time, DOGE traded at $0.149.
Featured image created with DALL.E, chart from TradingView.com