Charting The Roadmap Of BTC To $150,000 By 2025

Este artículo también está disponible en español.
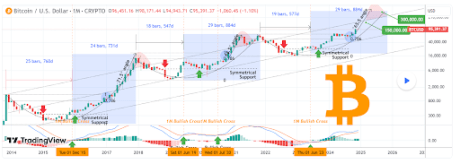
Crypto analyst TradingShot had predicted before that the Bitcoin price could rally to as high as $150,000 in this bull run. With the flagship crypto now close to the $100,000 milestone, the analyst has charted Bitcoin’s current price action and provided insights into how the crypto could reach this $150,000 target by 2025.
The Current Bitcoin Price Action And Road To $150,000
In a TradingView post, TradingShot stated that the Bitcoin price is now off the 0.786 to 1.0 Fibonacci range, where it consolidated from March 2024 until October 2024. The analyst noted how the breakout in October was largely thanks to the US presidential elections and the euphoria after Donald Trump won.
Related Reading
TradingShot said that the Bitcoin price is only one month outside this range and is already much higher. He noted that last month’s candle was similar to November 2020 and May 2017. Coincidentally, those periods were when the “most aggressive rallies of those bull cycles started.”
The crypto stated that the Bitcoin price was at a 71.5° angle between May and December 2017. In the 2021 cycle, Bitcoin was at a 68.5° angle (3° lower) between November 2020 and April 2021. If this happens to be a trend, TradingShot remarked that it is safe to assume that the 2024/2025 parabolic rally could be at a 65.5° angle (-3° from the previous cycle).

In line with this, TradingShot said that this gives the Bitcoin price a potential target of $300,000 as early as May 2025 if the crypto records a double top cycle as in 2021. Meanwhile, the crypto analyst asserted that the $150,000 target is “very plausible” from a technical analysis perspective since it is just below the top of a multi-year channel he highlighted on the chart.
BTC’s Next Move Still Unclear
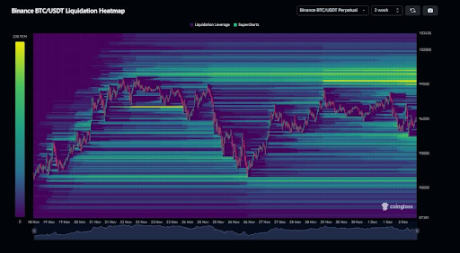
Amid this bullish prediction for the Bitcoin price, crypto analyst Kevin Capital has suggested that BTC’s move is still unclear. He stated that while Bitcoin has a lot of liquidity to the downside of about $88,000, the real bulk of liquidity is still around the $100,000 to $103,000 range. Based on this, the analyst stated that it is best to sit back and watch what comes next.

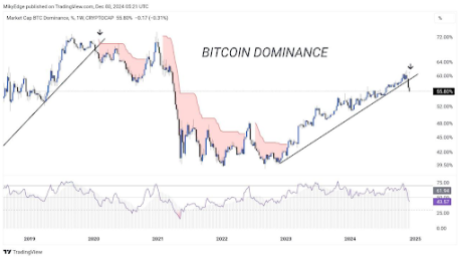
Meanwhile, crypto analyst Mikybull Crypto has suggested that the Bitcoin price may experience a cooling-off period in the meantime. This came as he revealed that the sell signal has flashed on Bitcoin’s dominance for the first time since 2020. In line with this development, he stated that it is officially altcoin season.
Related Reading

Blockchain center data shows that it is indeed altcoin season. In the last 90 days, 75% of the top 50 coins by market cap have outperformed the Bitcoin price. With this being altcoin season, Bitcoin could cool off while altcoins record parabolic rallies.

At the time of writing, the Bitcoin price is trading at around $95,600, down in the last 24 hours, according to data from CoinMarketCap.
Featured image created with Dall.E, chart from Tradingview.com


