


Bitcoin Price On The Verge Of Explosive 15% Breakout As Analyst Spots Triangle Formation

Reason to trust
![]()
Strict editorial policy that focuses on accuracy, relevance, and impartiality
Created by industry experts and meticulously reviewed
The highest standards in reporting and publishing
Strict editorial policy that focuses on accuracy, relevance, and impartiality
Morbi pretium leo et nisl aliquam mollis. Quisque arcu lorem, ultricies quis pellentesque nec, ullamcorper eu odio.
Este artículo también está disponible en español.
Bitcoin’s price is reaching a pivotal moment as it coils within a tightening triangle pattern that could soon resolve in a dramatic breakout. The ongoing consolidation around $80,000 to $85,000 is part of a classic technical setup that can cause strong directional moves in the market.
Notably, this triangle pattern was shared in an analysis on social media platform X by crypto analyst Ali Martinez, where he advised traders to keep a close eye on Bitcoin’s next breakout move.
Related Reading
The current pattern hints at a possible 15% swing in either direction, and with Bitcoin now hovering around $83,000, the stakes are high.
Triangle Pattern Forms As Bitcoin Compresses Between Lower Highs, Higher Lows
Martinez’s highlight of a triangle formation examines Bitcoin’s price action since March 7, when it briefly crashed from $91,000 until it broke below $80,000. The ensuing recovery above $80,000 eventually led to the Bitcoin price creating a lower high at $87,000 before correcting again.
Since then, Bitcoin’s price action has been highlighted by the formation of lower highs, higher lows, and an increasingly tightening range, all of which are classic parts of a triangle pattern formation.
Bitcoin is currently trading right in the heart of this tightening range. The 4-hour timeframe chart shows the upper trendline of the triangle, which caps the price at nearly $86,000, while the lower trendline provides support at around $82,000. These levels have effectively boxed in Bitcoin’s price over the past few weeks, and any clean breakout beyond these boundaries could define the cryptocurrency’s direction in the near term.
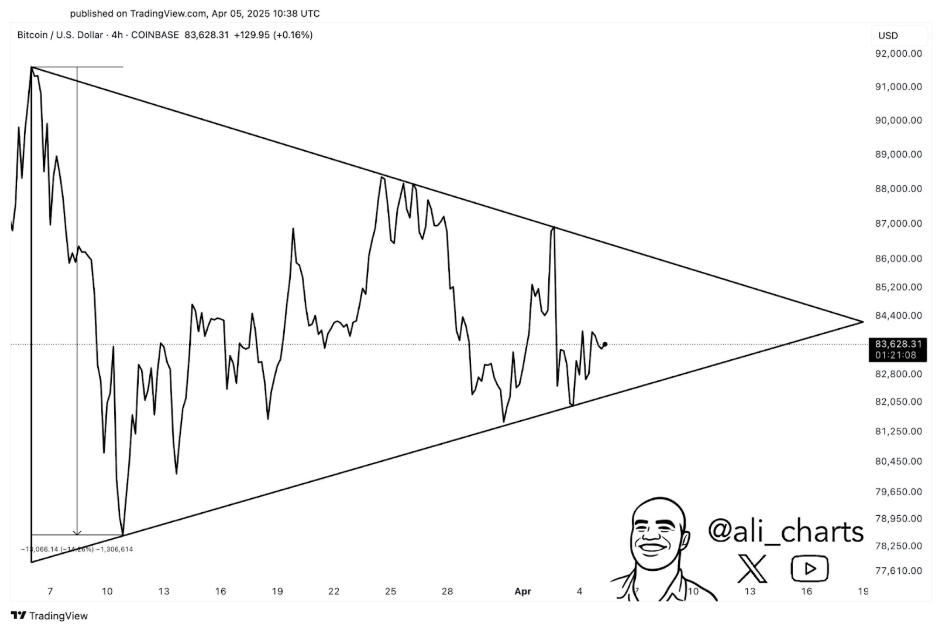
Image From X: @ali_charts
Analyst Predicts 15% Move, Warns Traders To Watch Closely
Martinez’s analysis points to a significant price shift once Bitcoin breaks out of the triangle. “#Bitcoin $BTC is consolidating within a triangle pattern, setting the stage for a potential 15% move. Watch closely for a breakout!” he wrote on X. The warning carries weight, especially for short-term traders and those managing leveraged positions.
If Bitcoin breaks above the $86,000 resistance line, it could spark a rally toward $90,000 or higher and usher in a renewed wave of bullish momentum. On the other side, a break below the $82,000 support could lead to a quick drop toward the $70,000 level, a scenario that would deal a harsh blow to bullish market sentiment and delay the hopes for predictions of new all-time highs.
Related Reading
Although a downward move to $70,000 would be brutal, its possibility cannot be ruled out, with the bull score currently at a low level of 10. Most investors are positioning for a bullish outcome and a return above $100,000, but analysis of buy zones shows that Bitcoin must break past $85,470 and $92,950 convincingly before this can happen.
At the time of writing, Bitcoin was trading at $83,070.
Featured image from Fortune, chart from TradingView